通常而言,在同一个文件中覆盖完整的流程将会导致Jupyter Notebook、脚本变成一团乱麻。此外,大多数的数据科学问题都要求我们在数据收集、数据清洗、数据探索、数据可视化和统计/预测建模中切换。
为了更好地理解原型和生产流两种思维模式,我们来处理一些真实的数据。我们将使用个人对个人的借贷网站——借贷俱乐部上面的借贷数据。跟银行不同,借贷俱乐部自身并不借钱,而是为贷款人提供一个市场以贷款给因不同的原因(比如维修、婚礼)需要借款的个人。
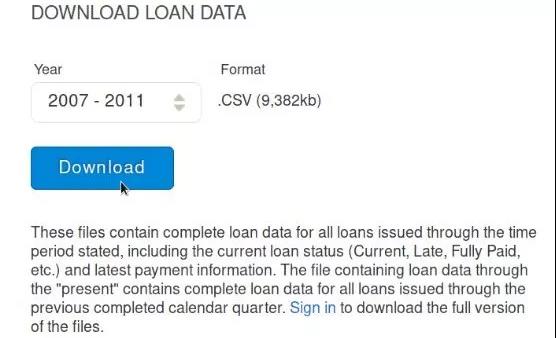
借贷俱乐部提供关于成功的贷款(被借贷俱乐部和联合贷款人通过的贷款)和失败的贷款(被借贷俱乐部和联合贷款人拒绝的贷款,款项并没有转手)的详尽历史数据。打开他们的数据下载页,选择2007-2011年,并下载数据:
数据下载页:
https://www.lendingclub.com/info/download-data.action

原型思维模式
在原型思维模式中,我们比较关心快速迭代,并尝试了解数据中包含的特征和事实。创建一个Jupyter Notebook,并增加一个Cell来解释:
你为了更好地了解借贷俱乐部而做的所有调查
有关你下载的数据集的所有信息
首先,让我们将csv文件读入pandas:
import pandas as pd
loans_2007 = pd.read_csv('LoanStats3a.csv')
loans_2007.head(2)
我们得到两部分输出,首先是一条警告信息:
/home/srinify/anaconda3/envs/dq2/lib/python3.6/site-packages/IPython/core/interactiveshell.py:2785: DtypeWarning: Columns (0,1,2,3,4,7,13,18,24,25,27,28,29,30,31,32,34,36,37,38,39,40,41,42,43,44,46,47,49,50,51,53,54,55,56,57,58,59,60,61,62,63,64,65,66,67,68,69,70,71,72,73,74,75,76,77,78,79,80,81,82,83,84,85,86,87,88,89,90,91,92,93,94,95,96,97,98,99,100,101,102,103,104,105,106,107,108,109,110,111,112,113,114,115,116,117,118,119,120,121,123,124,125,126,127,128,129,130,131,132,133,134,135,136,142,143,144) have mixed types. Specify dtype option on import or set low_memory=False.
interactivity=interactivity, compiler=compiler, result=result)
然后是数据框的前5行,这里我们就不展示了(太长了)。
警告信息让我们了解到如果我们在使用pandas.read_csv()的时候将low_memory参数设为False的话,数据框里的每一列的类型将会被更好地记录。
第二个输出的问题就更大了,因为数据框记录数据的方式存在着问题。JupyterLab有一个内建的终端,所以我们可以打开终端并使用bash命令head来查看原始文件的头两行数据。
head -2 LoanStats3a.csv
原始的csv文件第二行包含了我们所期望的列名,看起来像是第一行数据导致了数据框的格式问题:
Notes offered by Prospectus
https://www.lendingclub.com/info/prospectus.action
增加一个Cell来说明你的观察,并增加一个code cell来处理观察到的问题。
import pandas as pd
loans_2007 = pd.read_csv('LoanStats3a.csv', skiprows=1, low_memory=False)
在借贷俱乐部下载页查看数据字典以了解哪些列没有包含对特征有用的信息。Desc和url列很明显就没有太大的用处。
loans_2007 = loans_2007.drop(['desc', 'url'],axis=1)
然后就是将超过一半以上都缺失值的列去掉,使用一个cell来探索哪一列符合这个标准,再使用另一个cell来删除这些列。
loans_2007.isnull().sum()/len(loans_2007)
loans_2007 = loans_2007.dropna(thresh=half_count, axis=1)
因为我们使用Jupyter Notebook来记录我们的想法和代码,所以实际上我们是依赖于环境(通过IPython内核)来记录状态的变化。这让我们能够自由地移动cell,重复运行同一段代码,等等。
通常而言,原型思维模式专注于:
我们会花时间来探索数据并且写下我们采取哪些步骤来清洗数据,然后就切换到工作流模式,并且将代码写得更强壮一些。
生产流模式
在生产流模式,我们会专注于写代码来统一处理更多的情况。比如,我们想要可以清洗来自借贷俱乐部的所有数据集的代码,那么最好的办法就是概括我们的代码,并且将它转化为数据管道。数据管道是采用函数式编程
的原则来设计的,数据在函数中被修改,并在不同的函数之间传递:
函数式编程教程:
https://www.dataquest.io/blog/introduction-functional-programming-python/
这里是数据管道的第一个版本,使用一个单独的函数来封装数据清洗代码。
import pandas as pd
def import_clean(file_list):
frames = []
for file in file_list:
loans = pd.read_csv(file, skiprows=1, low_memory=False)
loans = loans.drop(['desc', 'url'], axis=1)
half_count = len(loans)/2
loans = loans.dropna(thresh=half_count, axis=1)
loans = loans.drop_duplicates()
# Drop first group of features
loans = loans.drop(["funded_amnt", "funded_amnt_inv", "grade", "sub_grade", "emp_title", "issue_d"], axis=1)
# Drop second group of features
loans = loans.drop(["zip_code", "out_prncp", "out_prncp_inv", "total_pymnt", "total_pymnt_inv", "total_rec_prncp"], axis=1)
# Drop third group of features
loans = loans.drop(["total_rec_int", "total_rec_late_fee", "recoveries", "collection_recovery_fee", "last_pymnt_d", "last_pymnt_amnt"], axis=1)
frames.append(loans)
return frames
frames = import_clean(['LoanStats3a.csv'])
在上面的代码中,我们将之前的代码抽象为一个函数。函数的输入是一个文件名的列表,输出是一个数据框的列表。
普遍来说,生产流思维模式专注于:
代码应该被泛化以匹配的类似的数据源
代码不应该太过泛化以至于难以理解
在不同的思维模式中切换
假设我们在运行函数处理所有来自借贷俱乐部的数据集的时候报错了,部分潜在的原因如下:
不同的文件当中列名存在差异
超过50%缺失值的列存在差异
数据框读入文件时,列的类型存在差异
在这种情况下,我们就要切换回原型模式并且探索更多。如果我们确定我们的数据管道需要更为弹性化并且能够处理数据特定的变体时,我们可以将我们的探索和管道的逻辑再结合到一起。
以下是我们调整函数以适应不同的删除阈值的示例:
import pandas as pd
def import_clean(file_list, threshold=0.5):
frames = []
for file in file_list:
loans = pd.read_csv(file, skiprows=1, low_memory=False)
loans = loans.drop(['desc', 'url'], axis=1)
threshold_count = len(loans)*threshold
loans = loans.dropna(thresh=half_count, axis=1)
loans = loans.drop_duplicates()
# Drop first group of features
loans = loans.drop(["funded_amnt", "funded_amnt_inv", "grade", "sub_grade", "emp_title", "issue_d"], axis=1)
# Drop second group of features
loans = loans.drop(["zip_code", "out_prncp", "out_prncp_inv", "total_pymnt", "total_pymnt_inv", "total_rec_prncp"], axis=1)
# Drop third group of features
loans = loans.drop(["total_rec_int", "total_rec_late_fee", "recoveries", "collection_recovery_fee", "last_pymnt_d", "last_pymnt_amnt"], axis=1)
frames.append(loans)
return frames
frames = import_clean(['LoanStats3a.csv'], threshold=0.7)
默认值是0.5,如果需要的话,我们也可以改为0.7。
这是一些将管道改得更为弹性的方式,按推荐程度降序排列:
这个管道可以扩展到数据科学工作流程的所有阶段。这是一些伪代码,可以总揽它的结构。
import pandas as pd
def import_clean(file_list, threshold=0.5):
## Code
def visualize(df_list):
# Find the most important features and generate pairwise scatter plots
# Display visualizations and write to file.
plt.savefig("scatter_plots.png")
def combine(df_list):
# Combine dataframes and generate train and test sets
# Drop features all dataframes don't share
# Return both train and test dataframes
return train,test
def train(train_df):
# Train model
return model
def validate(train_df, test-df):
# K-fold cross validation
# Return metrics dictionary
return metrics_dict
frames = import_clean(['LoanStats3a.csv', 'LoanStats2012.csv'], threshold=0.7)
visualize(frames)
train_df, test_df = combine(frames)
model = train(train_df)
metrics = test(train_df, test_df)
print(metrics)
下一步
如果你对加深理解和练习感兴趣的话,我推荐:
了解如何将你的管道转化为作为一个模块或者从命令行中单独运行的脚本:
https://docs.python.org/3/library/main.html
了解如何使用Luigi来构建更复杂的、能够在云上面运行的管道
https://marcobonzanini.com/2015/10/24/building-data-pipelines-with-python-and-luigi/
了解更多有关数据工程的信息:
https://www.dataquest.io/blog/tag/data-engineering/
原文标题:
Programming Best Practices For Data Science
原文链接:
https://www.kdnuggets.com/2018/08/programming-best-practices-data-science.html
